Metabolic Network Analysis - I
The Beginners’ guide
In this short tutorial, we will explore the basic steps of a metabolic network analysis.
For our convenience, we will avoid using full models or discuss their
reconstruction methods, instead focus on simple reactions to create
a theoretical background. However, the steps can be scaled without any loss of
generality. The related exercises should help build a theoretical background
along with necessary programming skills.
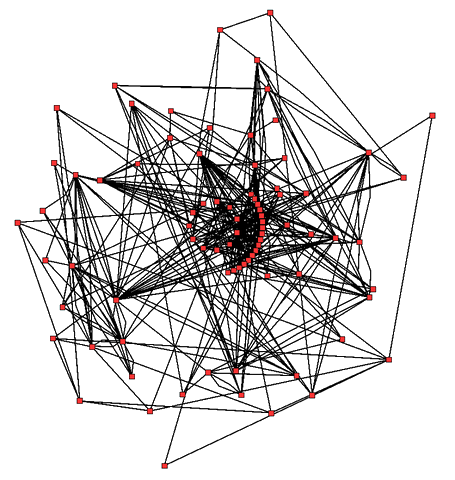 Metabolic network showing interactions between enzymes and metabolites in the Arabidopsis thaliana citric acid cycle. Enzymes and metabolites are the red dots and interactions between them are the lines. Wikipedia
Introduction
What is a metabolic network?
A metabolic network is just a collection of nodes and edges used to represent the relationship between different cellular components. These components could be genes, enzymes, reactions, metabolites or other factors. The nodes store data while edges relate them according to a specific nature of relationship. For example, think of a social network where people are nodes and edges store the friendship information.
A metabolic network, thus, must represent the metabolic process using nodes and edges.
Storing the data
Thousands of chemical reactions occur at a time, even in relatively simpler organisms like E.coli. A popular and computationally amenable way to store this information is in the form of a matrix, called a stoichiometry matrix.
A stoichiometry matrix records the relationship between different metabolites and the particular chemical reactions they participate in. If you are familiar with networks already, it is similar to an adjacency matrix representation.
Example
Consider the following sample of chemical reactions take from E.coli BL21(DE3) strain, a popularly used expression host.
$$ ade_c + prpp_c → amp_c + ppi_c \tag{1} $$ $$ 3amac_c + h_c + h2o_c → msa_c + nh4_c \tag{2} $$ $$ accoa_c + h2o_c + oaa_c → cit_c + coa_c + h_c \tag{3} $$
Hint: Confused about symbols? See 1, 2, 3
A complete set of reactions along with list of metabolites and genes for a particular organism can be obtained from online databases like BiGG, KEGG.
The dataset can be obtained in several file formats like JSON, SBML, or MAT depending on application used for further analysis. We’ll come back to this later.
Network construction
Creating stoichiometry matrix
To construct a stoichiometry matrix, we need to have the following information (both of which are present in model file):
- Participating metabolites \(( \vec{m} )\)
- (Balanced) Chemical reactions \(( \vec{R} )\)
Following from previous example, we can see that \( \vec{m} \) is a vector of size \( m = 13 \) (unique metabolites) and \( \vec{R} \) is of size \( n = 3 \). The resulting stoichiometry matrix \(( S )\) is of size \( m \times n \), where each row represents a metabolite and each column represents a reaction. Each cell \((c_{ij})\) populated using a simple rule — \(a\) if a metabolite is produced in that reaction, \(- a\) if consumed, 0 otherwise; where \(a\) is the stoichiometry coefficient of the metabolite.
For example, a stoichiometry for reaction \( (1) \) will be:
$$ \mathbf{S} = \left( \begin{array}{c|c} ade_c & -1\\ prpp_c & -1\\ amp_c & 1\\ ppi_c & 1 \\ \end{array}\right) $$
Exercise: Try writing S matrix for all three reactions.Exercise: Write a (Python?) script to create S matrix from a list of reactions.
Exercise: Write a program to find all the reactions in which a given metabolite participates.
Other matrices
Similarly, you can create different matrices containing other kind of reaction information. For example, elemental matrix (\( \vec{E} \)), charge-balance matrix, moiety matrix, flux matrix (\( \vec{v} \)).
These matrices combined with a stoichiometry matrix yield necessary information about a reaction, like atoms and charged species involved, rate of concentration changes etc.
The advantage of using matrices is that conservation principles can be verified through a simple matrix multiplication.
Visualizing the network
Once the metabolic network model grows beyond a few reactions and metabolites, it becomes increasingly difficult to visualize the relationship between the components. Visualization allows us to observe key network structures, critical pathways and important metabolites without much analysis.
Reaction and compound maps
A common strategy is to visualize the content of stoichiometry matrix in two ways - a reaction map and metabolite map.
A reaction map is drawn with metabolites as nodes and reactions as edges. The edges link the metabolite nodes which are consumed in the reaction to the metabolite nodes which are produced in the reaction. The nature of (ir)reversible nature of reaction can be indicated by the direction of the link.
On the other hand, a compound map consists of reactions as nodes and metabolites as edges. In a similar manner, edges link the reaction nodes where a metabolite is produced to the reaction where it is consumed.
Both of these representations draw attention to different aspects of the same metabolic network. For example, the reaction map allows us to visualize the most important metabolites of the network while the metabolite map allows us to distinguish the core reactions.
Exercise: Write the compound map for the S matrix of above three reactions.Exercise: Write a program to generate reaction and compound map graphs in memory.
Other tools
Some common ways to visualize a network is to use a tool like Cytospace or visANT.
Exercise: Draw the graphs using a visualization library in your language of choice (networkx in Python).Further
A lot remains to be discussed. In the next tutorial of this series, we’ll look closely at stoichiometry matrix, use complete models, derive useful properties, and learn ways to simulate the model. Towards the end, I hope that a small case-study will serve as a comprehensive example to assimilate all the information.
In the meantime, feel free to experiment with the exercises and send in your suggestions.